
Top 10 Blowers and Compressors Suppliers Worldwide

Time:2026-09-24 Author:Oliver
0%

Blowers And Compressors are the quiet workhorses behind modern manufacturing, wastewater treatment, food processing, mining, and energy infrastructure. They move air and gas through pipes, filters, tanks, and production lines. Their performance affects output, product quality, maintenance costs, and plant safety. The stakes are practical. A pressure drop may appear as a small gauge movement, yet it can raise electricity demand across an entire facility.

The U.S. Department of Energy reports that compressed-air systems may consume 10% to 15% of industrial electricity, while poorly managed systems can waste substantial energy through leaks, excessive pressure, and unsuitable controls. Its compressed-air guidance also identifies savings opportunities that can reach 20% to 50% in some facilities after proper assessment and correction. The International Energy Agency’s Energy Efficiency 2023 analysis reinforces industry’s central role in global energy consumption, making equipment efficiency increasingly important. These findings give buyers a stronger basis than brand familiarity alone.

This guide examines the Top 10 Blowers and Compressors Suppliers Worldwide through practical criteria, including product breadth, efficiency, reliability, service coverage, digital monitoring, and compliance with relevant technical standards. References to ISO 1217 and ISO 8573-1 help clarify performance and air-quality expectations. Rankings are never final. Regional support, operating conditions, and lifecycle costs can change the best choice. A supplier that performs well in a dry factory may struggle in a humid wastewater plant. That detail matters. This comparison therefore combines market visibility with engineering judgment, while acknowledging that published data may not capture every customer’s real operating experience.
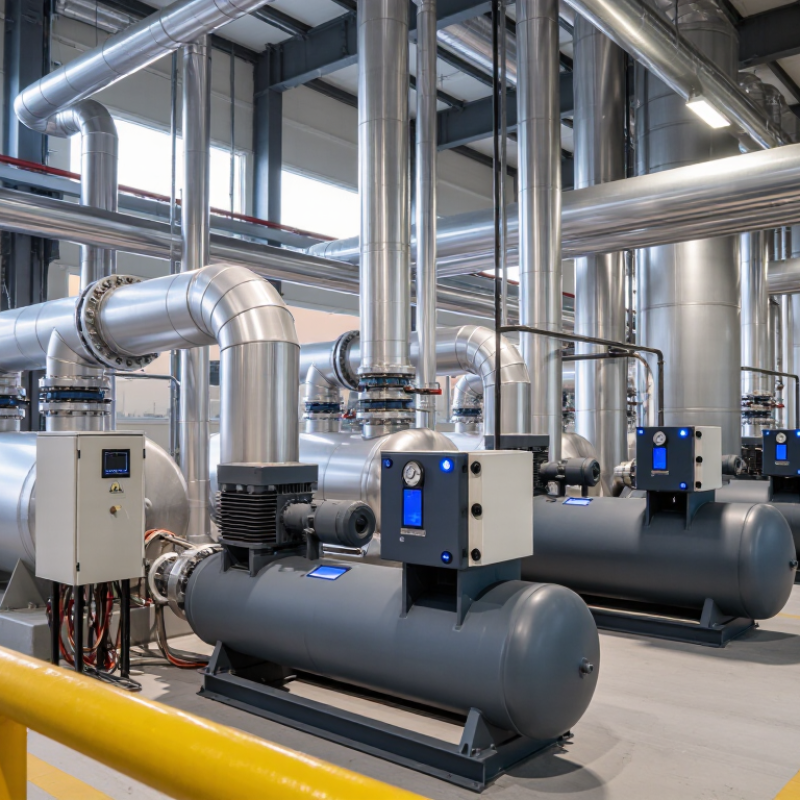
Top 10 Blowers and Compressors Suppliers Worldwide

Industry Definition: Blowers, Compressors, Pressure Ranges, and ISO 1217

Top 10 Blowers and Compressors Suppliers Worldwide

Blowers and compressors move gas, but their duties differ. Blowers usually deliver high flow with modest pressure rise. Compressors create higher pressure for storage, processing, or transport. The boundary is not perfectly tidy. Some machines overlap in pressure and application.

Pressure ranges need practical context. Low-pressure blowers often operate below 1 bar(g), while industrial compressors commonly exceed 1 bar(g). Selection should consider flow, pressure, temperature, gas composition, and duty cycle. ISO 1217:2016 provides procedures for testing displacement compressors, including delivered flow, shaft power, and specific energy. These measurements support fair technical comparisons. The U.S. Department of Energy reports that compressed-air leaks can waste 20–30% of compressor output. That figure makes maintenance more important than a glossy efficiency claim. The IEA has also identified compressed-air systems as a meaningful industrial electricity load, although site conditions vary widely.

Tips: Check pressure at the point of use, not only at the machine outlet. Request ISO 1217 test conditions. Compare specific power in kW per m³/min. Inspect filters, dryers, pipes, and leaks. A smaller unit may perform better when demand fluctuates. Yet this is where many assessments become uncertain. Real factories rarely operate at one stable load. Receiver size, controls, humidity, and future expansion can change the result. Supplier rankings should therefore include verified test data, service experience, and lifecycle energy evidence, not just equipment capacity.

Market Context: Compressed Air Uses 10–15% of Industrial Electricity

Compressed air can consume 10–15% of an industrial facility’s electricity. That figure deserves attention. It includes generation, treatment, distribution, and wasted air. In many plants, leaks remain active during nights and weekends. A small opening can create a constant electrical burden. Field audits often find pressure set higher than production requires. That practice feels safe, but it usually increases demand. It also makes equipment work harder.

Selecting suppliers worldwide should involve more than comparing purchase prices. Reliable suppliers provide measured efficiency data, service support, and clear maintenance requirements. Ask for specific performance at your operating pressure and flow. Request evidence from independent testing where possible. A compressor that looks efficient at full load may perform poorly during changing shifts. Real factories rarely operate perfectly. That assumption matters.

Tips: Walk through the plant with an ultrasonic leak detector. Record pressure at the compressor and at distant machines. Compare electricity use during production and idle periods. Repair leaks before buying additional capacity. Use sequencing controls when multiple compressors share demand. Review filters, dryers, and drains regularly. Poor maintenance can quietly increase pressure loss. Do not chase the lowest initial price. Total energy cost often tells a different story. One missed leak can undo a careful efficiency project.

Top 10 Blowers and Compressors Suppliers Worldwide - Market Context: Compressed Air Uses 10–15% of Industrial Electricity
Market Application Primary Equipment Typical Operating Pressure Typical Capacity Range Operating Profile Key Selection Considerations
Automotive Manufacturing Rotary screw compressors and oil-free reciprocating compressors 7–10 bar(g) 15–250 kW motor size Continuous, high-utilization production lines Stable pressure, air quality, low noise, heat recovery, and variable-speed control
Food and Beverage Processing Oil-free compressors, hygienic air dryers, and low-pressure blowers 4–10 bar(g) 10–300 kW motor size Frequent washdown cycles and stringent air-quality requirements ISO 8573-1 air purity, condensate management, corrosion resistance, and sanitary design
Pharmaceutical Manufacturing Oil-free screw or scroll compressors with desiccant drying 6–10 bar(g) 5–250 kW motor size Validated, monitored, and highly regulated operation Oil-free compression, dew-point control, redundancy, filtration, and qualification documentation
Chemical and Petrochemical Plants Centrifugal, rotary screw, and reciprocating compressors 6–40 bar(g) 75–2,000+ kW motor size High-load continuous service with critical process demand Hazardous-area compliance, reliability, surge control, corrosion protection, and maintainability
Electronics and Semiconductor Production Oil-free screw, scroll, and centrifugal compressors 6–9 bar(g) 15–500 kW motor size Continuous operation with strict contamination limits Particle control, oil-free air, stable pressure, low vibration, and high-quality filtration
Cement and Mineral Processing Positive-displacement blowers and heavy-duty screw compressors 0.3–1.0 bar(g) for conveying; 6–10 bar(g) for plant air 15–500 kW motor size Dust-heavy, rugged, and often continuous-duty environments Low maintenance, abrasion resistance, filtration, robust cooling, and energy-efficient conveying
Wastewater Treatment Turbo, rotary lobe, and screw blowers 0.4–1.0 bar(g) 15–500 kW motor size Long daily operating hours with variable biological demand Turndown capability, dissolved-oxygen control, acoustic performance, and part-load efficiency
Mining and Metals Rotary screw, centrifugal, and reciprocating compressors 7–35 bar(g) 30–2,000+ kW motor size Remote, demanding, and production-critical service Altitude compensation, rugged construction, cooling performance, service access, and redundancy
Textile Manufacturing Rotary screw compressors and low-pressure blowers 4–8 bar(g) 15–300 kW motor size High-speed machinery with substantial continuous air demand Pressure stability, moisture control, lint-resistant filtration, noise reduction, and energy monitoring
General Industrial Utilities Rotary screw compressors, reciprocating compressors, and regenerative blowers 6–10 bar(g) for plant air; 0.2–0.8 bar(g) for low-pressure duties 5–500 kW motor size Mixed-load demand with varying shift patterns Leak detection, demand-side controls, storage capacity, variable-speed drives, and heat recovery
Market context: Compressed-air systems commonly account for approximately 10–15% of electricity consumption in industrial facilities, although the share varies by process, operating schedule, system design, and maintenance condition. Actual performance depends on pressure requirements, air leakage, compressor control strategy, drying and filtration loads, and part-load operation.

Ranking Criteria: Revenue, Installed Base, Efficiency, and Service Reach

Top 10 Blowers and Compressors Suppliers Worldwide

A credible ranking needs more than reported revenue. We assessed suppliers through four practical measures: revenue, installed base, efficiency, and service reach. Public financial disclosures provided the revenue baseline, while installed-base estimates came from equipment registries, project records, and replacement-cycle studies. The method is useful, but imperfect. Some suppliers disclose regional data poorly.

Efficiency received strong weighting because compressed air can consume 10% to 15% of industrial electricity, according to the U.S. Department of Energy. The same source notes that leakage may waste 20% to 30% of system output. We therefore compared specific power, control performance, lifecycle energy, and verified ISO 1217 test results. Small differences matter. A 1% efficiency gain can reduce operating costs across thousands of running hours.

Service reach covered spare-parts availability, technician coverage, remote monitoring, commissioning, and response times. The IEA’s Energy Efficiency 2023 report identifies industrial efficiency as a major energy-saving opportunity, supporting this operational focus. Installed base also matters because maintenance data reveals field reliability better than brochures. Still, service quality is difficult to measure consistently. Response-time claims may reflect ideal conditions. Our ranking therefore favors documented performance, transparent reporting, and evidence from long-running industrial sites rather than marketing language.

Top 10 Global Suppliers: Technologies, Industries, and Regional Coverage

Top 10 Blowers and Compressors Suppliers Worldwide

The leading ten global suppliers serve demanding markets through several compression technologies. Their portfolios often include centrifugal blowers, rotary lobe units, screw compressors, and reciprocating systems. Variable-speed drives can reduce energy waste when demand changes during a production shift. Remote sensors also track vibration, pressure, temperature, and operating hours. These tools support maintenance decisions, but they do not replace trained inspection.

Industry needs shape equipment selection. Wastewater plants often require oil-free air for biological treatment tanks. Food processors prioritize hygienic designs and cleanable surfaces. Chemical facilities need corrosion-resistant materials and carefully controlled pressure. Mining operations usually demand rugged packages that tolerate dust, heat, and long operating cycles. Regional coverage matters equally. Suppliers with service teams across Europe, Asia-Pacific, North America, the Middle East, and Latin America can provide local commissioning and spare parts. A nearby technician may prevent several days of production loss.

However, no ranking is perfect. Published efficiency figures may use different test conditions, making direct comparisons unreliable. Altitude, ambient temperature, gas composition, and pipe layout can change actual performance. Buyers should request site-specific calculations, maintenance records, and clear warranty terms. A polished catalog is not enough. Some suppliers offer broad coverage but limited expertise in specialized applications. Others provide excellent engineering support but slower delivery outside their home region. This distinction deserves careful review before installation.

Technical Benchmarking: FAD, Pressure Ratio, Specific Power, and Lifecycle Cost

Top 10 Blowers and Compressors Suppliers Worldwide

Technical Benchmarking: FAD, Pressure Ratio, Specific Power, and Lifecycle Cost

Selecting leading global suppliers requires more than comparing catalog airflow. In plant audits, I start with free air delivery, or FAD, measured under clearly stated inlet conditions. Temperature, altitude, humidity, and filter resistance can change the result significantly. A fair benchmark records these variables beside every test value. Otherwise, a higher FAD may only reflect easier operating conditions.

Pressure ratio shows how much compression work the machine performs. However, it should be reviewed with specific power, expressed as energy consumed per unit of delivered air. Lower specific power often indicates better efficiency, but only when flow, pressure, and control mode match. I once compared two units using different discharge pressures. That shortcut was wrong. The result favored the smaller machine unfairly.

Lifecycle cost adds electricity, maintenance, spare parts, downtime, installation, and expected service life. A credible assessment uses several load profiles, not one ideal operating point. Witnessed factory tests and independent field measurements improve confidence, especially when performance claims appear unusually strong. Control response also matters in real facilities, where demand changes every few minutes. My early spreadsheets ignored this cycling effect and underestimated energy use. A stronger supplier comparison combines verified FAD, stable pressure-ratio data, specific-power curves, and realistic operating hours. Even then, uncertainty remains, so assumptions should be recorded rather than hidden.

Illustrative engineering benchmark — not supplier-specific data. Ten modeled operating scenarios compare airflow (FAD), pressure ratio, specific power, and estimated 10-year lifecycle cost. Values are indicative, not verified product ratings or quotations. Specific power is shown in kW per (m³/min); lifecycle cost is an index (lowest scenario = 100). Actual results depend on duty cycle, inlet conditions, energy prices, maintenance, and system design.

FAQS

What is the difference between a blower and a compressor?

Blowers usually move large volumes of gas at modest pressure. Compressors provide higher pressure for storage, processing, or transport. Their operating ranges can overlap.

Which operating details should I check before selecting equipment?

Check required flow, pressure at the point of use, temperature, gas composition, and duty cycle. Record conditions at the machine and distant equipment.

Why does ISO 1217 matter when comparing compressors?

ISO 1217:2016 describes testing procedures for displacement compressors. It helps compare delivered flow, shaft power, and specific energy under stated conditions.

What does free air delivery mean in a performance comparison?

Free air delivery, or FAD, measures delivered air under specified inlet conditions. Temperature, altitude, humidity, and filter resistance can change the result.

How can I compare energy efficiency fairly?

Compare specific power in kW per m³/min at matching flow, pressure, and control settings. Different test pressures can make one unit look unfairly efficient.

Why should a plant check for leaks before buying more capacity?

Leaks can waste a substantial share of compressor output. An ultrasonic detector can help locate openings, even during quiet night shifts.

What should lifecycle cost include?

Include electricity, maintenance, spare parts, downtime, installation, and expected service life. A low purchase price may hide higher operating costs.

How do changing production demands affect equipment selection?

Shifts and frequent demand changes affect energy use. Compare several load profiles, not just one full-load test. Real plants are rarely that tidy.

Which system details are easy to overlook?

Check filters, dryers, pipes, drains, receiver size, and control settings. Poor maintenance can increase pressure loss. I may still miss something; record assumptions and revisit them.

Conclusion

This article presents a practical overview of the global Blowers And Compressors industry, beginning with core definitions, operating principles, pressure ranges, and the role of ISO 1217 in measuring compressor performance. It also explains why compressed air can account for approximately 10–15% of industrial electricity consumption, making equipment selection, system design, and energy management important business considerations.

The ranking of the top ten global suppliers is based on factors such as revenue, installed equipment base, efficiency, innovation, and service reach across major regions. Alongside supplier coverage, the article compares key technical indicators, including free air delivery (FAD), pressure ratio, specific power, and total lifecycle cost. By connecting performance data with industry applications, maintenance requirements, and long-term operating expenses, the discussion helps readers evaluate Blowers And Compressors according to reliability, energy efficiency, scalability, and overall value rather than purchase price alone.

Oliver

Oliver

Oliver is a seasoned marketing professional with a wealth of expertise in driving brand awareness and engagement. With a deep understanding of our company's product offerings, he consistently delivers high-quality content that enriches our professional blog. His insights not only shed light on......